suiss/uim · Chart
Bar Chart Interactive
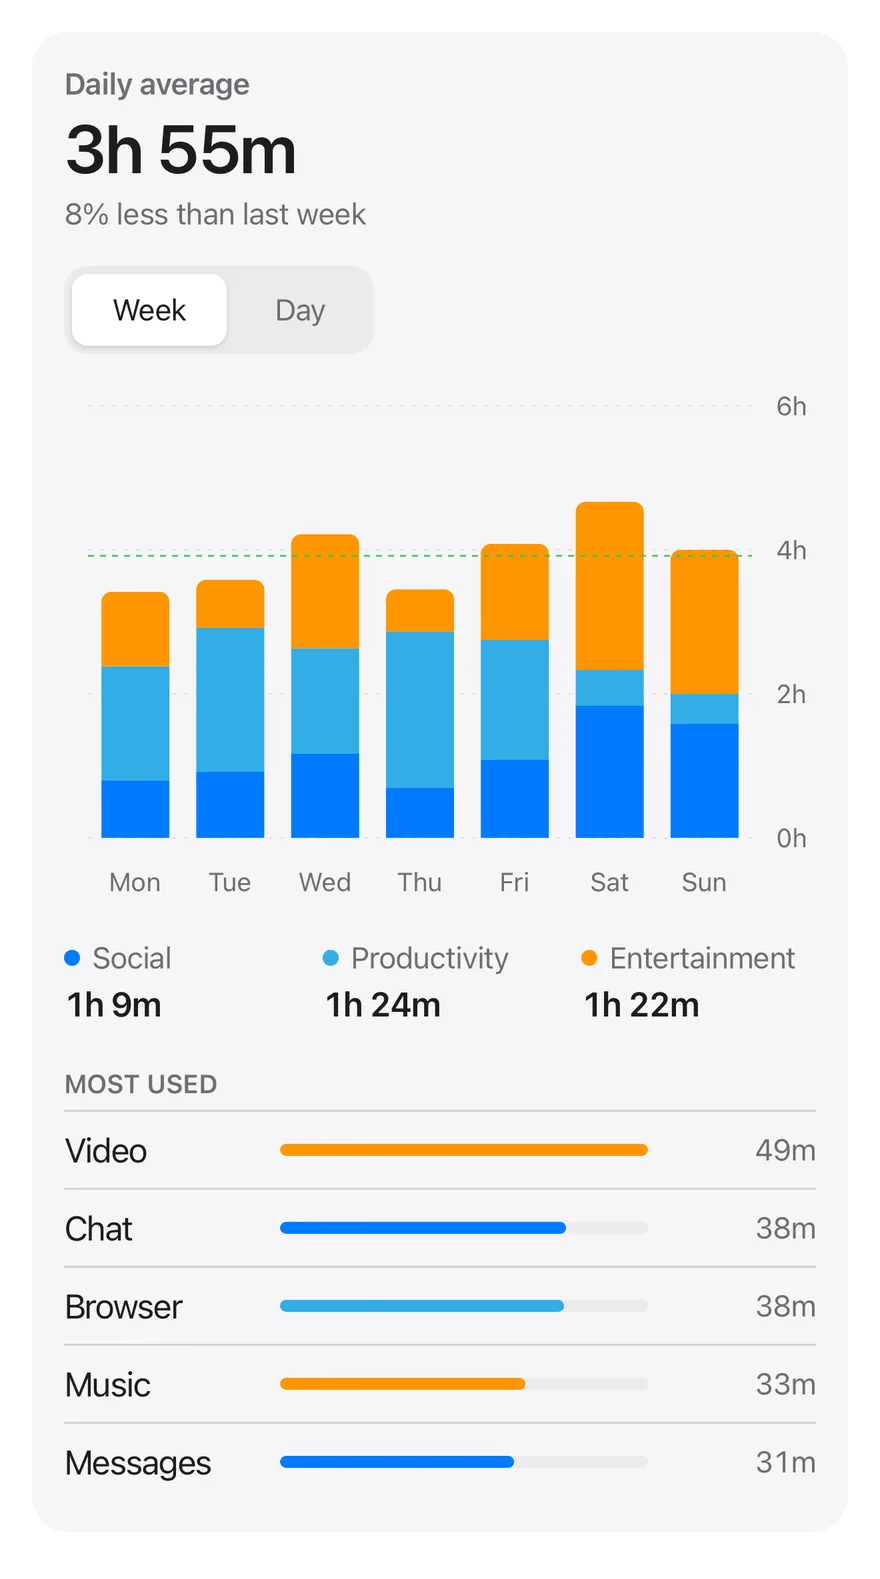
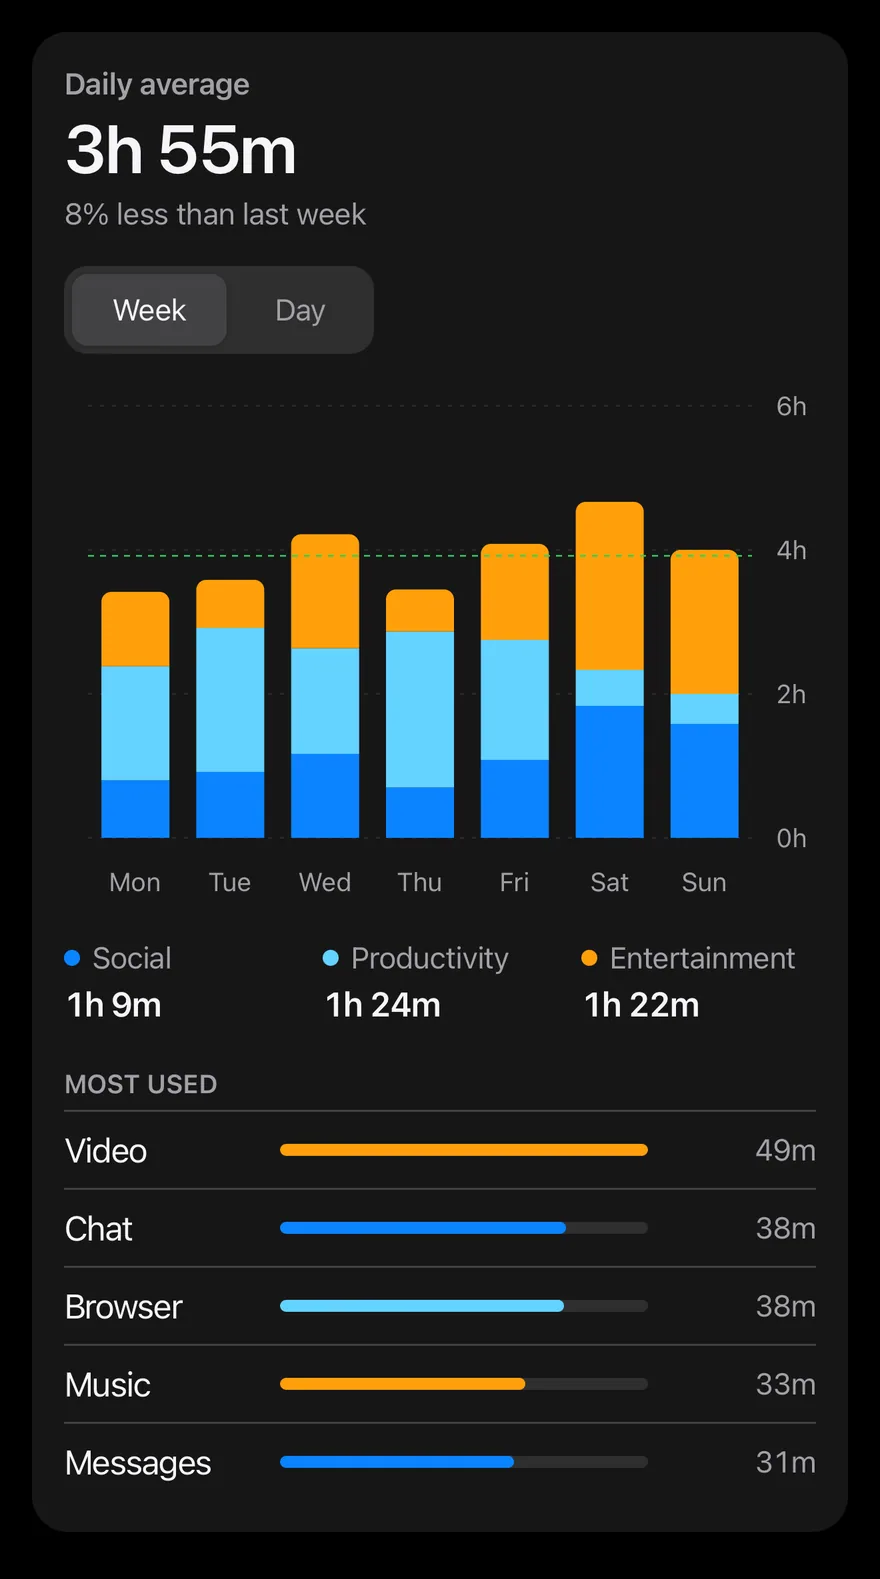
A screen-time dashboard with stacked category bars, a week and day toggle, and a list of most used apps.
Bar Chart Interactive is an open-source mobile chart from suiss/uim, drawn with react-native-svg for React Native and Expo, with SwiftUI and Jetpack Compose versions built from the same design tokens. The @esuiss/uim CLI copies its source into your project, so you own the code.
import { cn } from "cn"
import * as React from "react"
import { View } from "react-native"
import { Card, CardContent, CardHeader } from "@/components/ui/card"
import {
  Bar,
  BarChart,
  CartesianGrid,
  Cell,
  type ChartConfig,
  ChartContainer,
  ChartTooltip,
  ChartTooltipContent,
  ReferenceLine,
  XAxis,
YAxis,import Charts
import SwiftUI
private enum Category: String, CaseIterable {
case social, productivity, entertainment
}
private enum Period: String, CaseIterable {
case week, day
}
private let days = ["Monday", "Tuesday", "Wednesday", "Thursday", "Friday", "Saturday", "Sunday"]
private let usage: [[Double]] = [
[48, 95, 62], [55, 120, 40], [70, 88, 95], [42, 130, 35], [65, 100, 80], [110, 30, 140], [95, 25, 120],
]package com.esuiss.ui.charts
import androidx.compose.animation.core.animateFloatAsState
import androidx.compose.foundation.background
import androidx.compose.foundation.layout.Arrangement
import androidx.compose.foundation.layout.Box
import androidx.compose.foundation.layout.Column
import androidx.compose.foundation.layout.Row
import androidx.compose.foundation.layout.fillMaxHeight
import androidx.compose.foundation.layout.fillMaxWidth
import androidx.compose.foundation.layout.height
import androidx.compose.foundation.layout.padding
import androidx.compose.foundation.layout.size
import androidx.compose.foundation.layout.width
import androidx.compose.foundation.shape.CircleShape
import androidx.compose.foundation.shape.RoundedCornerShapeBars stack social, productivity and entertainment time. A ToggleGroup switches between a weekly view and an hourly view of one day. In the week view, touching a bar selects that day through onActiveIndexChange, dims the other days and updates the headline, comparison text, category totals and the most used apps list below. A dashed line marks the weekly average. The bars set isAnimationActive={false}, so they draw without the enter animation and switch views instantly.
Installation
$ pnpm dlx @esuiss/uim@latest add bar-chart-interactive$ pnpm dlx @esuiss/uim@latest add bar-chart-interactive --platform swift$ pnpm dlx @esuiss/uim@latest add bar-chart-interactive --platform kotlinThe CLI also adds what it builds on: Card, Chart, Text, Toggle Group.
Manual
- Install the dependencies:
npx expo install cn-
Add the pieces it builds on: Card, Chart, Text, Toggle Group.
-
Copy the source into
components/charts/bar-chart-interactive.tsx:
import { cn } from "cn"
import * as React from "react"
import { View } from "react-native"
import { Card, CardContent, CardHeader } from "@/components/ui/card"
import {
Bar,
BarChart,
CartesianGrid,
Cell,
type ChartConfig,
ChartContainer,
ChartTooltip,
ChartTooltipContent,
ReferenceLine,
XAxis,
YAxis,- Update the import paths to match your project.
- Install the dependencies:
npx expo install cn-
Add the pieces it builds on: Card, Chart, Text, Toggle Group.
-
Copy the source into
components/charts/bar-chart-interactive.tsx:
import { cn } from "cn"
import * as React from "react"
import { View } from "react-native"
import { Card, CardContent, CardHeader } from "@/components/ui/card"
import {
Bar,
BarChart,
CartesianGrid,
Cell,
type ChartConfig,
ChartContainer,
ChartTooltip,
ChartTooltipContent,
ReferenceLine,
XAxis,
YAxis,- Update the import paths to match your project.
-
Add the pieces it builds on: Card, Chart, Text, Toggle Group.
-
Copy the source into
components/charts/bar-chart-interactive.tsx:
import * as React from "react"
import { StyleSheet, View } from "react-native"
import { Card, CardContent, CardHeader } from "@/components/ui/card"
import {
Bar,
BarChart,
CartesianGrid,
Cell,
type ChartConfig,
ChartContainer,
ChartTooltip,
ChartTooltipContent,
ReferenceLine,
XAxis,
YAxis,
} from "@/components/ui/chart"- Update the import paths to match your project.
-
Target iOS 17 or later.
-
Add the Swift package to your app:
.package(url: "https://github.com/phosphor-icons/swift", from: "2.1.0")- Copy the theme files every view uses:
import SwiftUI
import UIKit
struct RGBA: Sendable {
let red: CGFloat
let green: CGFloat
let blue: CGFloat
let alpha: CGFloat
init(_ hex: UInt32, _ alpha: CGFloat = 1) {
red = CGFloat((hex >> 16) & 0xFF) / 255
green = CGFloat((hex >> 8) & 0xFF) / 255
blue = CGFloat(hex & 0xFF) / 255
self.alpha = alpha
}import SwiftUI
extension Color {
public static let surface = Color.adaptive(light: .init(0xFFFFFF), dark: .init(0x000000))
public static let surfaceSecondary = Color.adaptive(light: .init(0xF5F5F7), dark: .init(0x161617))
public static let surfaceTertiary = Color.adaptive(light: .init(0xE8E8ED), dark: .init(0x2C2C2E))
public static let surfaceRaised = Color.adaptive(light: .init(0xFFFFFF), dark: .init(0x1D1D1F))
public static let label = Color.adaptive(light: .init(0x1D1D1F), dark: .init(0xF5F5F7))
public static let labelSecondary = Color.adaptive(light: .init(0x6E6E73), dark: .init(0xA1A1A6))
public static let labelTertiary = Color.adaptive(light: .init(0x86868B), dark: .init(0x86868B))
public static let labelQuaternary = Color.adaptive(light: .init(0xD2D2D7), dark: .init(0x424245))
public static let control = Color.adaptive(light: .init(0x000000, 0.04), dark: .init(0xFFFFFF, 0.1))
public static let controlPressed = Color.adaptive(light: .init(0x000000, 0.12), dark: .init(0xFFFFFF, 0.22))
public static let controlSelected = Color.adaptive(light: .init(0x1D1D1F), dark: .init(0xF5F5F7))
public static let controlDisabled = Color.adaptive(light: .init(0x000000, 0.03), dark: .init(0xFFFFFF, 0.05))
public static let onControlSelected = Color.adaptive(light: .init(0xFFFFFF), dark: .init(0x000000))- Copy the source and every file it uses:
import Charts
import SwiftUI

private enum Category: String, CaseIterable {
  case social, productivity, entertainment
}

private enum Period: String, CaseIterable {
  case week, day
}

private let days = ["Monday", "Tuesday", "Wednesday", "Thursday", "Friday", "Saturday", "Sunday"]

private let usage: [[Double]] = [
  [48, 95, 62], [55, 120, 40], [70, 88, 95], [42, 130, 35], [65, 100, 80], [110, 30, 140], [95, 25, 120],
]import SwiftUI
public struct VariantButtonStyle: ButtonStyle {
public enum Variant: CaseIterable, Sendable {
case `default`, outline, secondary, tinted, ghost, plain, destructive, link
}
public enum Size: CaseIterable, Sendable {
case `default`, xs, sm, lg, xl, icon, iconXs, iconSm, iconLg, iconXl
var height: CGFloat {
switch self {
case .xs, .iconXs: 24
case .sm, .iconSm: 32
case .default, .icon: 36
case .lg, .iconLg: 44import SwiftUI
extension EnvironmentValues {
@Entry var buttonGroup: Axis? = nil
@Entry var buttonGroupSize: CGSize = .zero
}
enum ButtonGroupSpace: Hashable {
case group
}
struct ButtonGroupFrame {
let bounds: Anchor<CGRect>
let outlined: Bool
}import SwiftUI
public struct Card<Content: View>: View {
public enum Variant: CaseIterable, Sendable {
case `default`, filled
}
public enum Size: CaseIterable, Sendable {
case `default`, sm
var spacing: CGFloat {
switch self {
case .default: 24
case .sm: 16
}
}import Charts
import SwiftUI
public struct ChartConfig: ExpressibleByDictionaryLiteral, Sendable {
public struct Item: Sendable {
public var label: String?
public var color: Color?
public var icon: Image?
public init(_ label: String? = nil, color: Color? = nil, icon: Image? = nil) {
self.label = label
self.color = color
self.icon = icon
}
}import PhosphorSwift
import SwiftUI
extension Shadow {
static let control = Shadow(color: .black.opacity(0.08), radius: 0.5, y: 0.5)
static let thumb = Shadow(color: .black.opacity(0.12), radius: 1.5, y: 1)
}
struct SelectionIndicator<Mark: View>: View {
let checked: Bool
let pressed: Bool
let cornerRadius: CGFloat
let mark: Mark
@Environment(\.isEnabled) private var isEnabled
@Environment(\.isInvalid) private var invalidimport SwiftUI
extension EnvironmentValues {
@Entry public var isInvalid = false
@Entry var fieldInset = false
@Entry var fieldGroupInset = false
@Entry var fieldSetInset = false
}
extension View {
public func invalid(_ isInvalid: Bool = true) -> some View {
environment(\.isInvalid, isInvalid)
}
}
public enum FieldOrientation: CaseIterable, Sendable {import SwiftUI
extension EnvironmentValues {
@Entry public var hapticsEnabled = true
}
extension View {
public func haptics(_ enabled: Bool) -> some View {
environment(\.hapticsEnabled, enabled)
}
func hapticFeedback<Trigger: Equatable>(_ feedback: SensoryFeedback, trigger: Trigger) -> some View {
modifier(HapticFeedbackModifier(feedback: feedback, trigger: trigger) { _, _ in true })
}
func hapticFeedback<Trigger: Equatable>(import SwiftUI
public enum ItemVariant: CaseIterable, Sendable {
case `default`, outline, muted
}
public enum ItemSize: CaseIterable, Sendable {
case `default`, sm, xs
var horizontalPadding: CGFloat {
switch self {
case .default: 16
case .sm: 14
case .xs: 12
}
}import SwiftUI
public struct Separator: View {
let orientation: Axis
public init(_ orientation: Axis = .horizontal) {
self.orientation = orientation
}
public var body: some View {
Rectangle()
.fill(Color.separator)
.frame(width: orientation == .vertical ? 1 : nil, height: orientation == .horizontal ? 1 : nil)
.frame(maxWidth: orientation == .horizontal ? .infinity : nil, maxHeight: orientation == .vertical ? .infinity : nil)
.accessibilityHidden(true)
}import SwiftUI
public enum TextVariant: CaseIterable, Sendable {
case `default`, h1, h2, h3, h4, p, blockquote, code, lead, large, small, muted
var style: TextStyle {
switch self {
case .h1: .xl3
case .h2: .xl2
case .h3: .xl
case .h4, .lead, .large: .lg
case .code, .small, .muted: .sm
default: .base
}
}import SwiftUI
public enum ToggleVariant: CaseIterable, Sendable {
case `default`, outline
}
public enum ToggleSize: CaseIterable, Sendable {
case `default`, sm, lg
var height: CGFloat {
switch self {
case .default: 36
case .sm: 32
case .lg: 40
}
}import SwiftUI
struct ToggleGroupContext {
var variant: ToggleVariant
var size: ToggleSize
var spacing: Int
var orientation: Axis
var namespace: Namespace.ID
var multiple: Bool
var isSelected: (AnyHashable) -> Bool
var toggle: (AnyHashable) -> Void
var segmented: Bool { spacing == 0 && variant == .default }
var attached: Bool { spacing == 0 && variant == .outline }
}- Add the files to your app target.
- Set
minSdkto 24 or higher and add the dependencies:
implementation(platform("androidx.compose:compose-bom:2026.09.00"))
implementation("androidx.compose.foundation:foundation")
implementation("androidx.compose.ui:ui")
implementation("com.adamglin:phosphor-icon-android:1.0.0")- Copy the theme files every view uses:
package com.esuiss.ui.theme
import androidx.compose.foundation.isSystemInDarkTheme
import androidx.compose.runtime.Composable
import androidx.compose.runtime.CompositionLocalProvider
import androidx.compose.runtime.Immutable
import androidx.compose.runtime.staticCompositionLocalOf
import androidx.compose.ui.Modifier
import androidx.compose.ui.draw.dropShadow
import androidx.compose.ui.graphics.Color
import androidx.compose.ui.graphics.Shape
import androidx.compose.ui.graphics.shadow.Shadow as DropShadow
import androidx.compose.ui.text.TextStyle
import androidx.compose.ui.text.style.LineHeightStyle
import androidx.compose.ui.unit.Dp
import androidx.compose.ui.unit.DpOffsetpackage com.esuiss.ui.theme
import androidx.compose.runtime.Immutable
import androidx.compose.ui.graphics.Color
import androidx.compose.ui.unit.dp
@Immutable
data class Colors(
val surface: Color,
val surfaceSecondary: Color,
val surfaceTertiary: Color,
val surfaceRaised: Color,
val label: Color,
val labelSecondary: Color,
val labelTertiary: Color,
val labelQuaternary: Color,- Copy the source and every file it uses:
package com.esuiss.ui.charts

import androidx.compose.animation.core.animateFloatAsState
import androidx.compose.foundation.background
import androidx.compose.foundation.layout.Arrangement
import androidx.compose.foundation.layout.Box
import androidx.compose.foundation.layout.Column
import androidx.compose.foundation.layout.Row
import androidx.compose.foundation.layout.fillMaxHeight
import androidx.compose.foundation.layout.fillMaxWidth
import androidx.compose.foundation.layout.height
import androidx.compose.foundation.layout.padding
import androidx.compose.foundation.layout.size
import androidx.compose.foundation.layout.width
import androidx.compose.foundation.shape.CircleShape
import androidx.compose.foundation.shape.RoundedCornerShapepackage com.esuiss.ui.components
import androidx.compose.foundation.background
import androidx.compose.foundation.border
import androidx.compose.foundation.layout.Arrangement
import androidx.compose.foundation.layout.Column
import androidx.compose.foundation.layout.ColumnScope
import androidx.compose.foundation.layout.Row
import androidx.compose.foundation.layout.RowScope
import androidx.compose.foundation.layout.fillMaxWidth
import androidx.compose.foundation.layout.padding
import androidx.compose.foundation.shape.RoundedCornerShape
import androidx.compose.foundation.text.BasicText
import androidx.compose.runtime.Composable
import androidx.compose.runtime.CompositionLocalProvider
import androidx.compose.runtime.compositionLocalOfpackage com.esuiss.ui.components
import androidx.compose.animation.core.Animatable
import androidx.compose.animation.core.CubicBezierEasing
import androidx.compose.animation.core.Easing
import androidx.compose.animation.core.LinearEasing
import androidx.compose.animation.core.tween
import androidx.compose.foundation.Canvas
import androidx.compose.foundation.background
import androidx.compose.foundation.border
import androidx.compose.foundation.gestures.detectHorizontalDragGestures
import androidx.compose.foundation.gestures.detectTapGestures
import androidx.compose.foundation.layout.Arrangement
import androidx.compose.foundation.layout.Box
import androidx.compose.foundation.layout.BoxScope
import androidx.compose.foundation.layout.BoxWithConstraintspackage com.esuiss.ui.components
import androidx.compose.foundation.background
import androidx.compose.foundation.border
import androidx.compose.foundation.interaction.MutableInteractionSource
import androidx.compose.foundation.interaction.collectIsPressedAsState
import androidx.compose.foundation.layout.Box
import androidx.compose.foundation.layout.size
import androidx.compose.foundation.selection.triStateToggleable
import androidx.compose.foundation.shape.RoundedCornerShape
import androidx.compose.runtime.Composable
import androidx.compose.runtime.getValue
import androidx.compose.runtime.remember
import androidx.compose.ui.Alignment
import androidx.compose.ui.Modifier
import androidx.compose.ui.graphics.Colorpackage com.esuiss.ui.components
import androidx.compose.runtime.compositionLocalOf
import androidx.compose.ui.graphics.Color
import androidx.compose.ui.text.TextStyle
import androidx.compose.ui.unit.Dp
import androidx.compose.ui.unit.dp
val LocalContentStyle = compositionLocalOf { TextStyle.Default }
val LocalContentColor = compositionLocalOf { Color.Unspecified }
val LocalIconSize = compositionLocalOf { 20.dp }package com.esuiss.ui.components
import androidx.compose.foundation.background
import androidx.compose.foundation.gestures.Orientation
import androidx.compose.foundation.layout.Arrangement
import androidx.compose.foundation.layout.Box
import androidx.compose.foundation.layout.Column
import androidx.compose.foundation.layout.ColumnScope
import androidx.compose.foundation.layout.LayoutScopeMarker
import androidx.compose.foundation.layout.Row
import androidx.compose.foundation.layout.RowScope
import androidx.compose.foundation.layout.fillMaxWidth
import androidx.compose.foundation.layout.heightIn
import androidx.compose.foundation.layout.padding
import androidx.compose.foundation.shape.RoundedCornerShape
import androidx.compose.foundation.text.BasicTextpackage com.esuiss.ui.components
import android.provider.Settings
import androidx.compose.animation.core.CubicBezierEasing
import androidx.compose.foundation.background
import androidx.compose.foundation.border
import androidx.compose.foundation.gestures.Orientation
import androidx.compose.foundation.text.selection.TextSelectionColors
import androidx.compose.runtime.Composable
import androidx.compose.runtime.mutableStateOf
import androidx.compose.runtime.remember
import androidx.compose.ui.Modifier
import androidx.compose.ui.draw.clip
import androidx.compose.ui.draw.drawWithContent
import androidx.compose.ui.geometry.Offset
import androidx.compose.ui.geometry.Sizepackage com.esuiss.ui.components
import androidx.compose.runtime.Composable
import androidx.compose.runtime.CompositionLocalProvider
import androidx.compose.runtime.remember
import androidx.compose.runtime.staticCompositionLocalOf
import androidx.compose.ui.hapticfeedback.HapticFeedback
import androidx.compose.ui.hapticfeedback.HapticFeedbackType
import androidx.compose.ui.platform.LocalHapticFeedback
val LocalHapticsEnabled = staticCompositionLocalOf { true }
@Composable
fun ProvideHaptics(enabled: Boolean, content: @Composable () -> Unit) {
CompositionLocalProvider(LocalHapticsEnabled provides enabled, content = content)
}package com.esuiss.ui.components
import androidx.compose.foundation.Image
import androidx.compose.foundation.layout.size
import androidx.compose.runtime.Composable
import androidx.compose.ui.Modifier
import androidx.compose.ui.graphics.Color
import androidx.compose.ui.graphics.ColorFilter
import androidx.compose.ui.graphics.takeOrElse
import androidx.compose.ui.graphics.vector.ImageVector
import androidx.compose.ui.unit.Dp
import com.esuiss.ui.theme.EsuissTheme
@Composable
fun Icon(
imageVector: ImageVector,package com.esuiss.ui.components
import androidx.compose.foundation.layout.Arrangement
import androidx.compose.foundation.layout.Row
import androidx.compose.foundation.layout.RowScope
import androidx.compose.foundation.text.BasicText
import androidx.compose.runtime.Composable
import androidx.compose.runtime.CompositionLocalProvider
import androidx.compose.ui.Alignment
import androidx.compose.ui.Modifier
import androidx.compose.ui.text.font.FontWeight
import androidx.compose.ui.unit.dp
import com.esuiss.ui.theme.EsuissTheme
import com.esuiss.ui.theme.Typography
@Composablepackage com.esuiss.ui.components
import androidx.compose.foundation.background
import androidx.compose.foundation.gestures.Orientation
import androidx.compose.foundation.layout.Box
import androidx.compose.foundation.layout.fillMaxHeight
import androidx.compose.foundation.layout.fillMaxWidth
import androidx.compose.foundation.layout.height
import androidx.compose.foundation.layout.width
import androidx.compose.runtime.Composable
import androidx.compose.ui.Modifier
import androidx.compose.ui.unit.dp
import com.esuiss.ui.theme.EsuissTheme
@Composable
fun Separator(package com.esuiss.ui.components
import androidx.compose.animation.core.animateFloatAsState
import androidx.compose.animation.core.tween
import androidx.compose.foundation.background
import androidx.compose.foundation.border
import androidx.compose.foundation.interaction.MutableInteractionSource
import androidx.compose.foundation.interaction.collectIsPressedAsState
import androidx.compose.foundation.layout.Arrangement
import androidx.compose.foundation.layout.Row
import androidx.compose.foundation.layout.RowScope
import androidx.compose.foundation.layout.defaultMinSize
import androidx.compose.foundation.layout.height
import androidx.compose.foundation.layout.padding
import androidx.compose.foundation.selection.selectable
import androidx.compose.foundation.selection.toggleablepackage com.esuiss.ui.components
import androidx.compose.animation.core.Animatable
import androidx.compose.animation.core.CubicBezierEasing
import androidx.compose.animation.core.tween
import androidx.compose.foundation.background
import androidx.compose.foundation.border
import androidx.compose.foundation.gestures.Orientation
import androidx.compose.foundation.interaction.MutableInteractionSource
import androidx.compose.foundation.interaction.collectIsPressedAsState
import androidx.compose.foundation.layout.Arrangement
import androidx.compose.foundation.layout.Box
import androidx.compose.foundation.layout.Column
import androidx.compose.foundation.layout.IntrinsicSize
import androidx.compose.foundation.layout.Row
import androidx.compose.foundation.layout.RowScope- Update the
com.esuiss.uipackage names to match your project.
Usage
import { BarChartInteractive } from "@/components/charts/bar-chart-interactive"<BarChartInteractive />Replace USAGE with daily minutes per category and APPS with your apps and their share of each category. The hourly view is generated from PROFILE, so swap hourly() for real data. The component takes no props.